
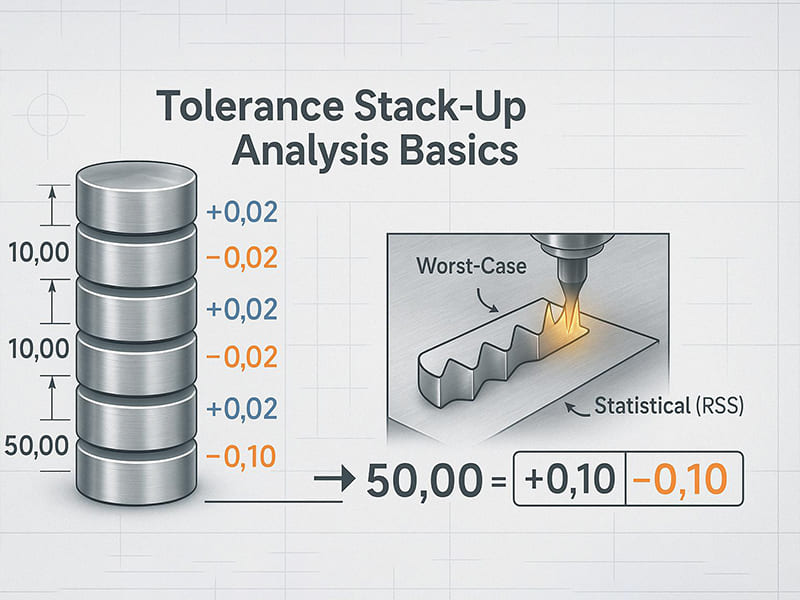
Five CNC-machined parts, each within spec at ±0.05 mm. Stack them in an assembly and the worst-case accumulated variation hits ±0.25 mm — enough to cause interference at one end of the tolerance range and excessive clearance at the other. We see this play out regularly in gearbox housings, bearing assemblies, and multi-component fixtures. Every individual part passes inspection, but the assembly doesn’t work. That’s tolerance stack-up, and it’s one of the most common — and most preventable — sources of assembly failure in precision manufacturing.
This article explains tolerance stack-up analysis from an engineering and manufacturing perspective: what it is, why it matters, the three main calculation methods (worst-case, RSS, Monte Carlo), step-by-step analysis workflow, how GD&T improves control, how manufacturing process capability affects results, common assembly problems caused by stack-up, and practical strategies for reducing accumulated variation. Whether you’re a designer sizing tolerances, an engineer troubleshooting assembly issues, or a buyer evaluating supplier capability, the goal is to turn tolerance stack-up from a hidden risk into a managed design parameter.
What Is Tolerance Stack-Up?
Tolerance stack-up is the cumulative effect of individual dimensional variations when multiple parts assemble together. Every CNC-machined component has a tolerance range — not a perfect dimension. When these parts connect in sequence along a dimensional chain, their variations add up, potentially changing the final assembly gap, fit, or alignment beyond acceptable limits.
A dimensional chain (tolerance loop) is the sequence of dimensions connecting two functional points. For example: Housing Thickness + Spacer Length + Bearing Width + Shaft Shoulder = Final Assembly Gap. Each dimension contributes variation that affects the result.
Tolerance stack-up occurs because no manufacturing process produces perfectly identical parts. Even precision CNC machining introduces variation from tool wear, thermal expansion, material differences, and measurement uncertainty. The more parts in the chain, the more variation accumulates.
Why Tolerance Stack-Up Matters
Without stack-up analysis, accumulated variation creates three categories of problems:
Assembly interference. Parts can’t fit together because cumulative dimensions exceed the available space. A shaft at maximum size plus a bearing at minimum clearance equals a press that won’t go together.
Excessive clearance. All dimensions deviate toward minimum material condition, creating loose fits that cause vibration, noise, and reduced positioning accuracy.
Functional failure. Misaligned gears, improperly preloaded bearings, or leaking seals — all from accumulated variation that nobody calculated during design.
The cost dimension matters equally. Overly tight tolerances (specified without analysis) increase machining cost, inspection time, and scrap rate. Based on our production data, tolerance stack-up analysis during design typically reduces assembly-related rework by 40–60% compared to projects where tolerances are specified by habit rather than calculation.
Three Analysis Methods
Worst-Case Analysis
Assumes every dimension simultaneously reaches its extreme limit. Total variation = sum of all individual tolerances. T_assembly = T₁ + T₂ + T₃ + … + Tₙ
Most conservative approach — guarantees all assemblies fit under any combination. The trade-off: often requires tighter individual tolerances, increasing machining cost. Standard for safety-critical systems (aerospace, medical devices) where assembly failure is unacceptable.
Statistical (RSS) Analysis
Recognizes that not all parts simultaneously hit their worst-case limits. Manufacturing variations typically follow normal distributions. T_assembly = √(T₁² + T₂² + T₃² + … + Tₙ²)
Produces smaller predicted assembly variation than worst-case — typically 40–60% less for a 5-part chain. Allows wider individual tolerances and lower manufacturing cost. Widely used in automotive, electronics, and general mechanical design where statistical confidence (typically 99.73% at ±3σ) is acceptable.
Monte Carlo Simulation
Computer-generated random sampling across thousands of dimensional combinations. Each dimension follows its actual distribution (often normal, but can model real manufacturing data). Results predict assembly yield, failure probability, and sensitivity to individual dimensions.
Best for complex assemblies with many contributors, non-normal distributions, or when optimizing cost versus yield trade-offs. One common pitfall we see: teams running Monte Carlo with assumed normal distributions when their actual CNC process produces skewed output — always use real capability data when available.
| Method | Safety | Cost Impact | Best For |
|---|---|---|---|
| Worst-case | Very conservative | Higher manufacturing cost | Safety-critical systems |
| RSS | Balanced | Lower cost | General mechanical design |
| Monte Carlo | Probability-based | Optimized | Complex assemblies |
Step-by-Step Analysis Workflow
1. Identify the tolerance loop. Define the dimensional chain connecting the two functional points of interest (clearance, alignment, gap).
2. Collect tolerance data. Gather nominal dimensions and tolerances from drawings, GD&T specs, and supplier capability data.
3. Convert to variation ranges. Calculate max and min limits for each dimension.
4. Calculate stack-up. Apply worst-case, RSS, or Monte Carlo depending on application requirements.
5. Validate assembly fit. Compare calculated variation against functional limits. If variation exceeds requirements → tighten critical tolerances, modify geometry, or change the dimensional chain.
In our shop floor experience, step 1 is where most analysis errors originate. Engineers frequently miss a contributor in the chain — a coating thickness, a gasket compression, or a press-fit interference — that shifts the result by more than the entire tolerance budget.
How GD&T Improves Stack-Up Control
Geometric Dimensioning and Tolerancing (per ASME Y14.5 or ISO 1101) improves tolerance stack-up control by focusing on functional relationships rather than individual dimensions.
Position tolerance controls hole and feature locations relative to datums, maintaining assembly alignment even when individual linear dimensions vary.
Flatness tolerance ensures contact surfaces meet evenly, preventing gaps that add to the stack-up chain.
Runout tolerance controls rotational accuracy of shafts and cylinders, reducing alignment errors in bearing and gear assemblies.
Profile tolerance controls complex surface shapes with a single tolerance zone, reducing the number of independent dimensions in the chain.
GD&T reduces stack-up errors by defining geometric relationships relative to functional datums — eliminating redundant tolerance chains, improving inspection clarity, and allowing wider individual tolerances where function permits.
Manufacturing Process Impact
Process capability directly determines how much variation each part contributes to the stack-up.
| Process | Typical Tolerance | Stack-Up Impact |
|---|---|---|
| CNC milling | ±0.01–0.05 mm | Moderate accumulation |
| CNC turning | ±0.005–0.02 mm | Lower accumulation |
| Grinding | ±0.002–0.005 mm | Minimal variation |
| Die casting | ±0.1–0.3 mm | Significant accumulation |
| Sand casting | ±0.5–1.5 mm | Requires secondary machining |
When performing stack-up analysis, use realistic manufacturing capability — not drawing tolerances. A tolerance of ±0.01 mm on a drawing only helps if the CNC process actually holds ±0.01 mm consistently. Cpk data from the production process provides the most accurate input for statistical analysis.
Common Assembly Problems
Interference fits — shaft at maximum + hole at minimum = assembly impossible. Critical in bearing, gear, and shaft-hub connections.
Excessive clearance — all dimensions at minimum material condition create loose fits, vibration, and positioning errors.
Misalignment — cumulative positional errors shift shaft-bearing relationships, gear mesh patterns, and load distributions. Even small alignment errors multiply into vibration and accelerated wear.
Functional failure — improper gear engagement, seal leakage, or motion inaccuracy when the dimensional chain exceeds system limits.
These problems typically surface during prototype assembly or early production — exactly when tolerance stack-up analysis should have been performed during design.
Strategies for Reducing Stack-Up
Optimize tolerance allocation. Tighten tolerances on critical features (bearing seats, locating surfaces) and widen them on non-critical dimensions. Based on our production data, selective tightening of 2–3 key dimensions while relaxing 5–6 others typically reduces total machining cost by 15–25% without affecting assembly function.
Apply GD&T properly. Use datum-based positional tolerancing per ASME Y14.5 to control functional relationships directly. This eliminates redundant dimensions from the tolerance chain.
Improve machining precision. Use CNC turning and grinding for critical features. Higher-precision processes reduce individual variation, which compounds through the chain.
Design for manufacturability (DFM). Reduce part count to shorten the dimensional chain. Design self-locating features (pins, shoulders, pilots) that constrain assembly variation mechanically. Replace stacked spacers with single precision-machined components.
Conclusion
Tolerance stack-up analysis predicts how individual part variations combine to affect assembly fit, alignment, and function. Worst-case, RSS, and Monte Carlo methods give engineers tools to quantify this risk at different confidence levels. GD&T focuses tolerance control on functional relationships. Manufacturing process capability determines how much variation each part actually contributes.
Performing this analysis during design — not after prototype assembly fails — prevents interference, excess clearance, and functional failure while keeping machining costs under control. Need help with tolerance stack-up analysis or precision CNC machining for your assemblies? [Contact our engineering team] for DFM review and manufacturing support.
FAQ
What is tolerance stack-up?
The cumulative effect of dimensional variations when multiple parts assemble together along a dimensional chain. Each part’s tolerance range contributes to total assembly variation. Without analysis, this accumulated variation causes interference, excessive clearance, or misalignment — even when every individual part passes inspection.
What is worst-case vs. RSS tolerance analysis?
Worst-case assumes all dimensions simultaneously hit extreme limits (sum of tolerances). RSS assumes statistical distribution and calculates the square root of summed squared tolerances — typically predicting 40–60% less variation than worst-case. Worst-case guarantees all assemblies fit; RSS provides more cost-effective tolerances with statistical confidence.
How does CNC machining affect tolerance stack-up?
CNC process capability determines individual part variation. Precision CNC milling holds ±0.01 mm, turning ±0.005–0.01 mm, and grinding ±0.002–0.005 mm. Less precise processes (casting, forging) contribute more variation. Choosing higher-precision processes for critical features directly reduces total stack-up.
How does GD&T improve tolerance control?
GD&T defines geometric relationships (position, flatness, runout, profile) relative to functional datums per ASME Y14.5. This focuses tolerance control on assembly requirements rather than individual dimensions, eliminating redundant tolerance chains and allowing wider tolerances where function permits.
What software supports tolerance stack-up analysis?
CETOL, Sigmetrix, and SolidWorks TolAnalyst integrate with CAD systems for 3D tolerance chain analysis. Most support worst-case, RSS, and Monte Carlo simulation methods. For simple chains, spreadsheet calculations work well. For complex assemblies with dozens of contributors, dedicated software significantly reduces analysis time and error risk.


